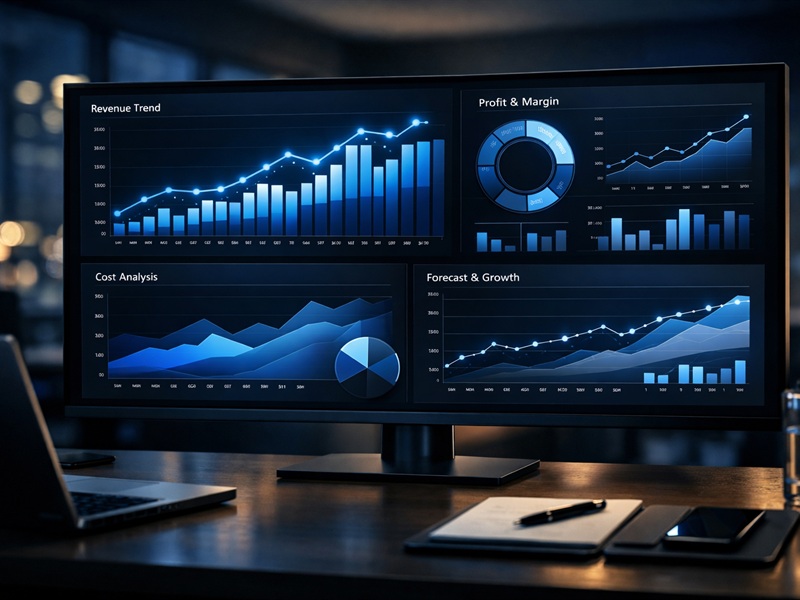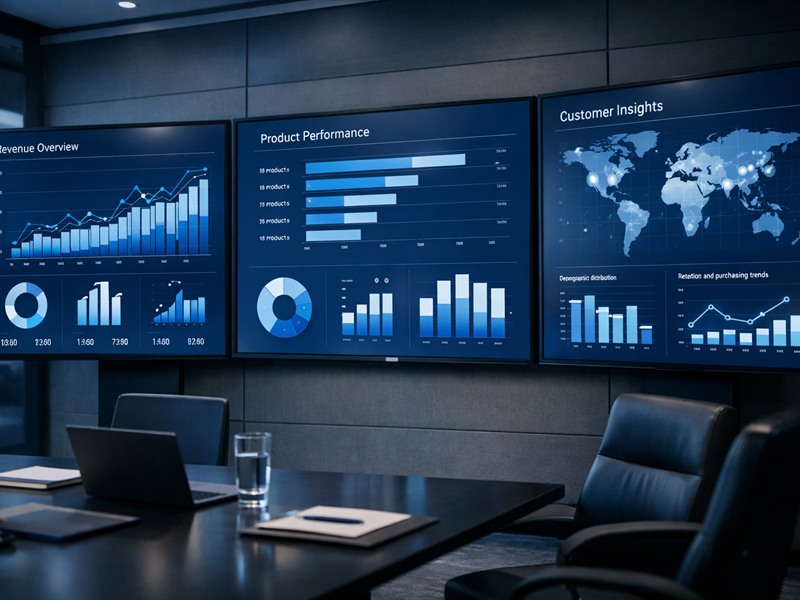
Retail Performance Dashboard
A unified analytics dashboard built to monitor sales, customer trends, product performance, and branch-level KPIs across multiple retail operations.
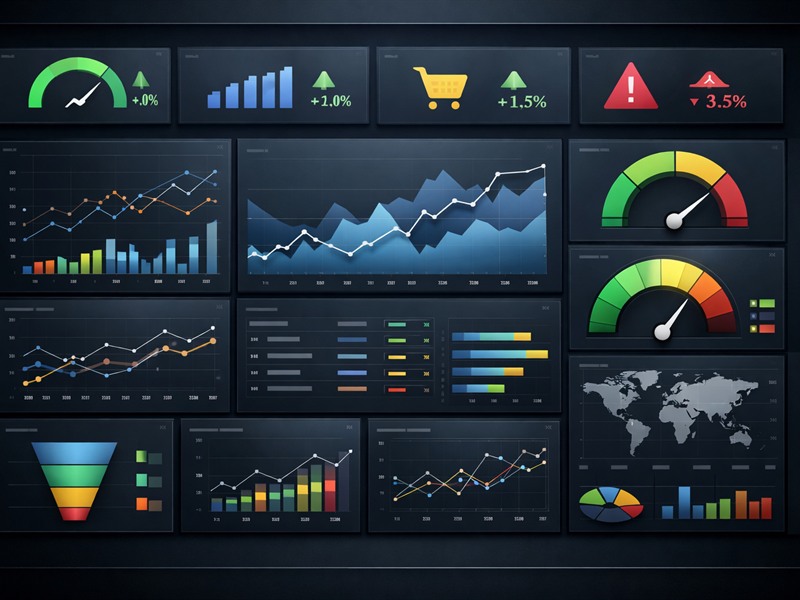
- Centralized daily and monthly sales visibility
- Improved category and location performance tracking
- Faster leadership reporting and trend interpretation